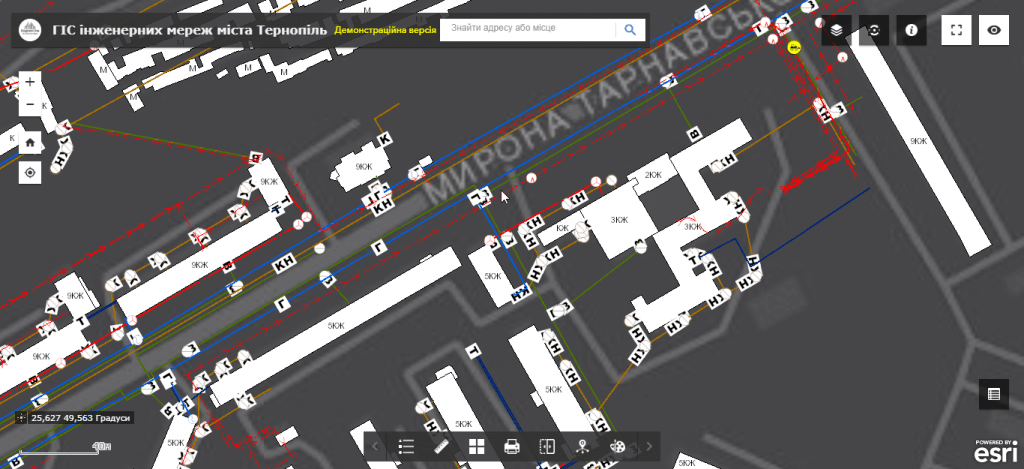
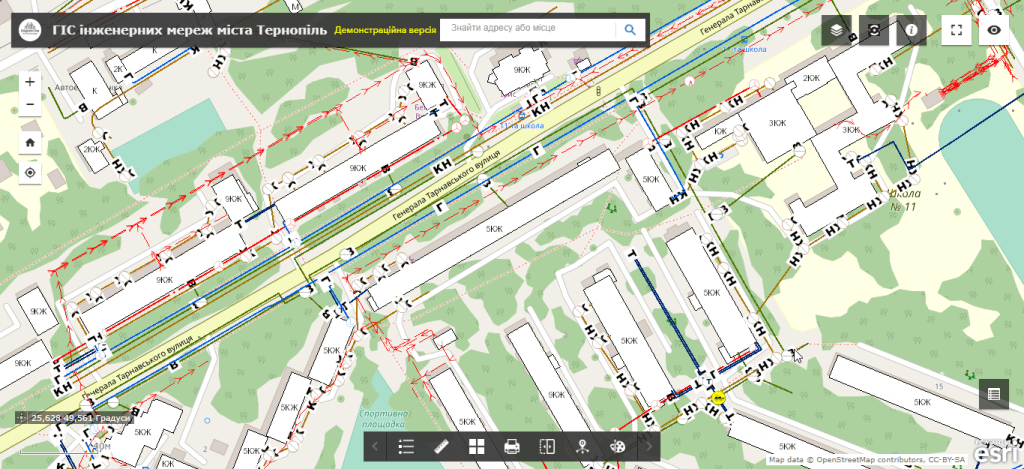
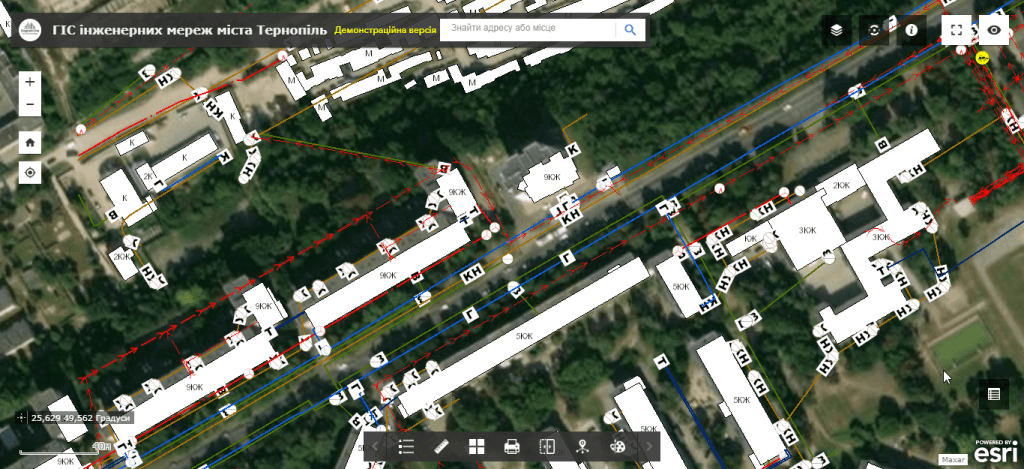
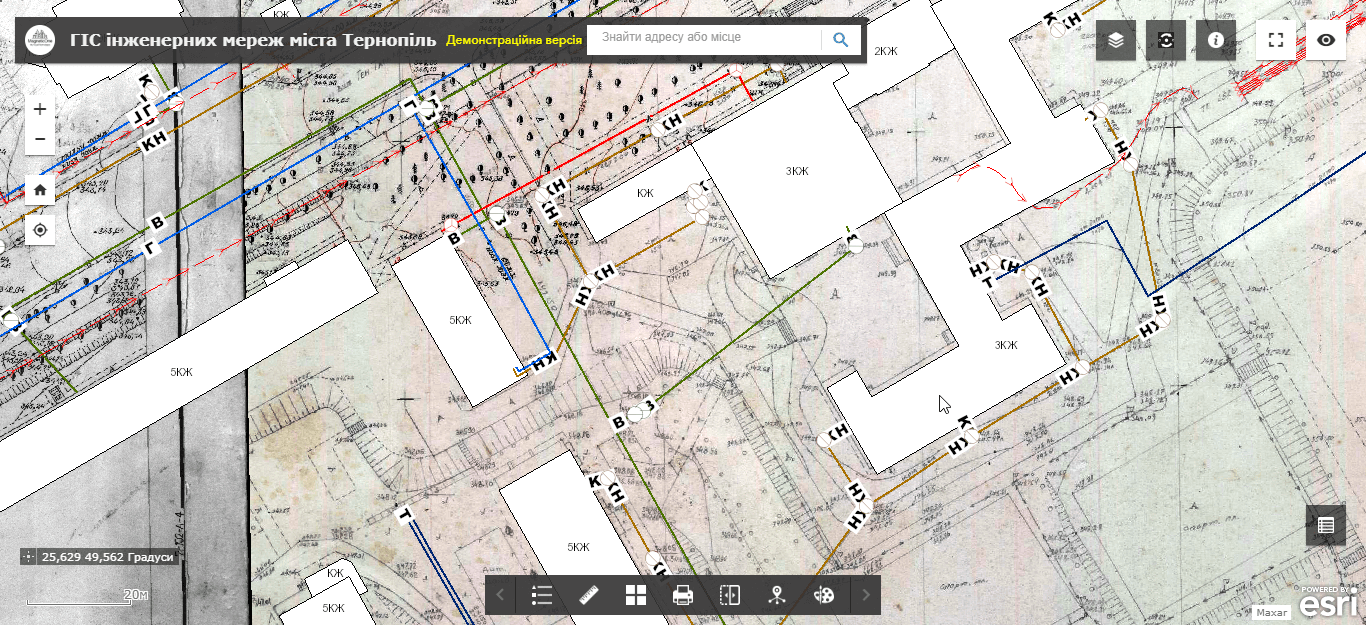
M1MT: Interactive map of engineering networks

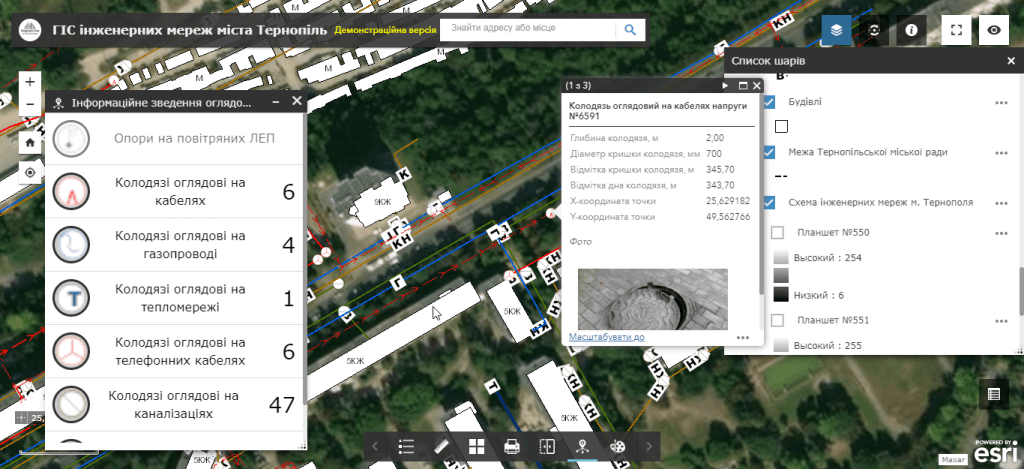
M1MT: Interactive map of engineering networks – is a web-mapping product designed for storing, accumulating and displaying information about the urban engineering infrastructure (sewer and heat networks; underground water pipes, gas pipelines; power lines, power and communication cables; manholes, etc.). Spatial information on the map is divided into thematic categories, each of which contains several layers with the possibility of finding the corresponding object and obtaining additional information about it: the exact coordinates of the engineering network objects and their main characteristics, the mutual location of various types of networks, the main landmarks for their unmistakable finding (distance from the nearest buildings, roadway, etc.).

Features of the interactive map

  • mapping of engineering infrastructure of the city;
  • moving around the map, changing the display scale;
  • connection and disconnection of data to the display set (layer of buildings and structures, roads, etc.);
  • connection of satellite images and other raster materials for display;
  • display of data and detailed reference information on a separate object;
  • viewing data on a mobile device (smartphone, tablet) connected to the Internet;
  • conducting an audit of engineering networks in real time, creating field survey journals;
  • execution of spatial and attribute queries, the ability to search.
Геоінформаційна система інженерних мереж

Use a wide range of analytical capabilities of an interactive map of engineering networks

  • get a flexible platform for easy maintenance of a cartographic database and inventory of utilities (sewer and heat networks; underground water pipelines, gas pipelines; power lines, communication and power cables, viewing wells, etc.);
  • get quick access to information on engineering communications and their detailed technical specifications;
  • increase the efficiency of dispatch services (locate wells, pipelines, and other necessary facilities as accurately as possible);
  • predict the direction of development of engineering infrastructure, effectively manage the utilities of the city;
  • respond promptly to accidents and emergencies (including external ones, regarding a specific type of communication), spatially localize them;
  • provide information support for the needs of preventive and emergency repair work by entering into the database information on the time of the last survey or repair of engineering networks;
  • conduct operational audits of engineering networks with the ability to make changes to the database in real time, create field survey journals;
  • ensure interaction with territorial services and authorities (land cadastre, environmental protection, etc.).

A set of interactive map layers includes

  • a layer of buildings and structures with additional information (purpose – residential / non-residential, number of floors, information about the nature of engineering communications inside buildings, etc.);
  • information about the relief, including the height of the terrain, the depth of the wells for the maintenance of relevant engineering networks;
  • networks of water supply, sewage, gas pipelines, heating network with the diameter and material of pipes, the dates of commissioning, the last repair and etc;
  • electrical networks, power cables with the corresponding technical parameters (number of cables, voltage, etc.);
  • inspection wells and their technical characteristics (belonging to the type of networks, depth, exact coordinates, etc.);
  • appropriate security zones indicating the nature of the restrictions.
Геоінформаційна система інженерних мереж

Requirements, cost and timing of the order

Information sources and materials (documents) for creating a web-map: official data and documents of town-planning documentation, town-planning tablets (on a scale of 1: 500, 1: 2000) of the relevant utilities (water utility, underground gas pipelines, electricity networks, etc.) , maps, electronic registries, carriers of information about engineering networks in local government and executive authorities.

The cost of creating an interactive map is based on the number of thematic map layers and the number of engineering infrastructure objects, the branching of the database, as well as individual customer requirements for functionality. The timing of creating a web map depends on the area of ​​the city and is consistent after reading the town planning documentation.

Services which will be provided prior to implementation of the map

  • Consulting
  • Scanning of paper documents and maps
  • Georeferencing of cartographic materials
  • Digitization
  • Provisioning of interactive map database

Learn more

Close
Коротка інформація

[contact-form-7 id=”10714″ title=”Форма партнерства”]


×